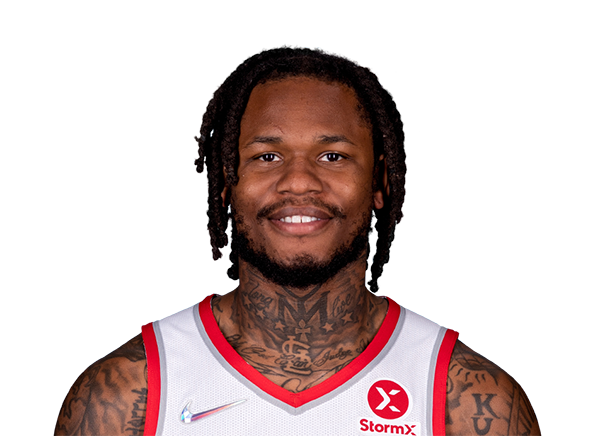
Anthony Peeler or Michael Jordan? The NBA Stat Breakdown

**Statistical Domination** This isn't even close to a fair fight. Jordan obliterates Peeler in seven of eight categories, posting more than triple Peeler's scoring output (30.3 vs 9.8 PPG) while grabbing more rebounds (6.3 vs 2.6), dishing more assists (5.3 vs 2.4), and generating twice as many steals (2.4 vs 1.0). Jordan's superior 49% field goal percentage and 83% free throw shooting showcase elite efficiency across the board.
**Signature Strengths** Peeler's lone statistical victory comes from beyond the arc, where his 37% three-point shooting represents genuine NBA-level competency as a spot-up threat. But Jordan's signature strength encompasses everything else: elite scoring, lockdown defense, clutch gene, and an unmatched competitive fire that elevated teammates and terrorized opponents. Jordan didn't just fill up box scores—he dominated games.
**The Verdict** One player was a solid role player who could knock down open threes; the other revolutionized basketball and won six championships while redefining what greatness looks like. Peeler's three-point edge is like bringing a water gun to a nuclear war. **Michael Jordan is incomparably superior.**
Who is better, Anthony Peeler or Michael Jordan?
Michael Jordan holds the statistical edge, winning 7 of 8 categories in this career comparison. Michael Jordan's Blocks Per Game of 0.8 versus Anthony Peeler's 0.2 is the most decisive factor — a 300% difference.
How do Anthony Peeler and Michael Jordan compare in Blocks Per Game?
Anthony Peeler career Blocks Per Game: 0.2. Michael Jordan career Blocks Per Game: 0.8. Michael Jordan leads by 300% — dramatically ahead in this key SG metric.
Who had the better overall career, Anthony Peeler or Michael Jordan?
Based on career statistics, Michael Jordan edges Anthony Peeler 7-1 across key categories. Michael Jordan's Blocks Per Game of 0.8 leads Anthony Peeler's 0.2 by 300%, providing the clearest statistical evidence of the career advantage.