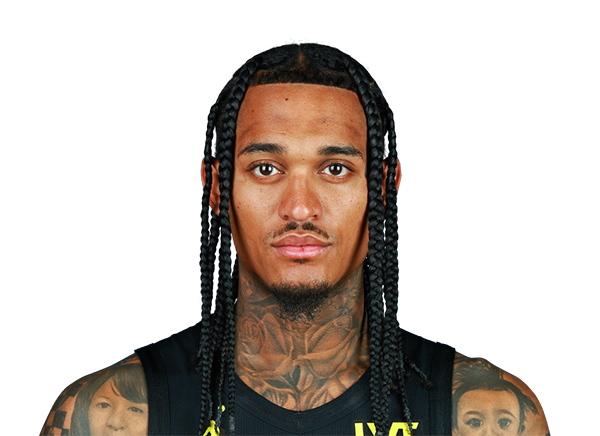
Comparing Blake Griffin and Jordan Clarkson Head to Head

**Blake Griffin dominates this statistical matchup decisively, winning four of six major categories.** His 19.3 points per game demolish Clarkson's 15.2, while his 7.9 rebounds completely dwarf Clarkson's measly 3.2. Griffin also edges assists 4.2 to 2.5 and blocks 0.5 to 0.2, showcasing superior all-around production. Clarkson only claims victory in three-point shooting (35% vs 29%) and free throws (82% vs 71%).
**Griffin's signature strength is his complete floor dominance as a power forward** – he can score inside and out, crash the boards relentlessly, and facilitate offense from the frontcourt. Meanwhile, **Clarkson's calling card is pure shooting efficiency from distance**, making him a valuable spot-up threat and secondary scorer off the bench.
**This comparison isn't even close despite their identical 45% field goal percentages.** Griffin impacts winning in multiple ways every night with his rebounding, passing, and scoring versatility, while Clarkson remains primarily a one-dimensional scorer. Griffin's peak as a franchise cornerstone and All-Star separates him from Clarkson's role-player ceiling. **Blake Griffin is unquestionably the superior player.**
Who is better, Blake Griffin or Jordan Clarkson?
Blake Griffin holds the statistical edge, winning 5 of 7 categories in this career comparison. Blake Griffin's Rebounds Per Game of 8.0 versus Jordan Clarkson's 3.2 is the most decisive factor — a 150% difference.
How do Blake Griffin and Jordan Clarkson compare in Rebounds Per Game?
Blake Griffin career Rebounds Per Game: 8.0. Jordan Clarkson career Rebounds Per Game: 3.2. Blake Griffin leads by 150% — dramatically ahead in this key PF metric.
Who had the better overall career, Blake Griffin or Jordan Clarkson?
Based on career statistics, Blake Griffin edges Jordan Clarkson 5-2 across key categories. Blake Griffin's Rebounds Per Game of 8.0 leads Jordan Clarkson's 3.2 by 150%, providing the clearest statistical evidence of the career advantage.