Brad Wanamaker vs Kobe Bryant: Who Wins on NBA Stats?
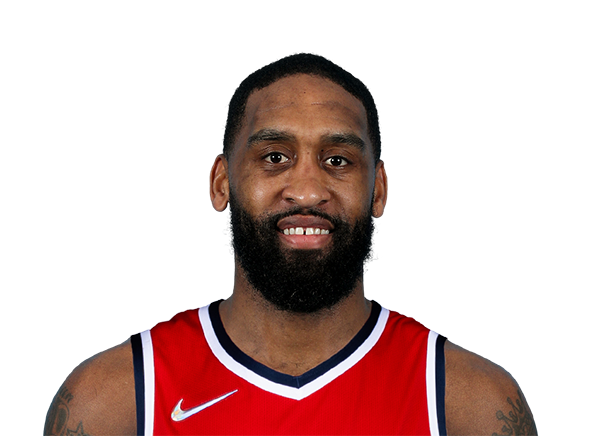
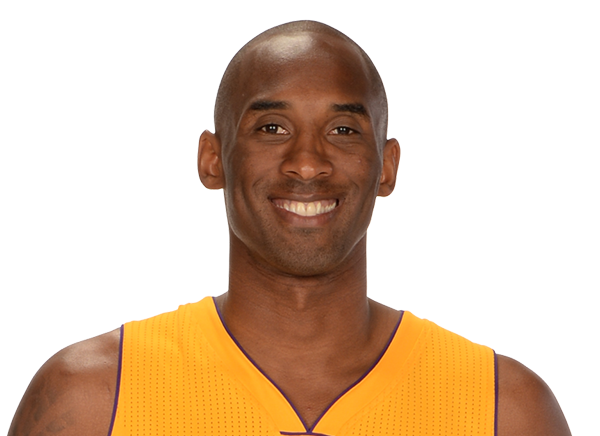
The career statistics tell a clear story in this PG comparison. Kobe Bryant holds the advantage in 7 of 8 key categories, with Points Per Game representing the most decisive gap — a 354.5% difference that separates these two NBA players. This is not a close debate on the numbers.
Kobe Bryant's Points Per Game of 25.0 compared to Brad Wanamaker's 5.5 represents a 354.5% advantage — dramatically better than their counterpart in this critical category. Brad Wanamaker falls 61.3% below the career average of 14.2 in this category while Kobe Bryant exceeds it. It is the single most decisive number in this comparison and the clearest statistical argument for Kobe Bryant's edge.
The most competitive category in this matchup is Field Goal %, where Brad Wanamaker posts 42.1% against Kobe Bryant's 44.7% — a gap of just 6.2%. Brad Wanamaker can point to this as evidence that the overall comparison is closer than the final 7-1 tally suggests. In any debate, Field Goal % is the statistical ammunition for the Brad Wanamaker side.
In NBA history, backcourt players are judged on their ability to create offense for themselves and teammates alike. Points per game captures scoring but assists and efficiency metrics reveal the complete offensive picture.
Kobe Bryant wins this head to head comparison decisively — 7 categories to 1. The 354.5% gap in Points Per Game alone makes a compelling case, but the consistency across multiple categories confirms Kobe Bryant's statistical superiority in this NBA career comparison.
Who is better, Brad Wanamaker or Kobe Bryant?
Kobe Bryant holds the statistical edge, winning 7 of 8 categories in this career comparison. Kobe Bryant's Points Per Game of 25.0 versus Brad Wanamaker's 5.5 is the most decisive factor — a 354.5% difference.
How do Brad Wanamaker and Kobe Bryant compare in Points Per Game?
Brad Wanamaker career Points Per Game: 5.5. Kobe Bryant career Points Per Game: 25.0. Kobe Bryant leads by 354.5% — dramatically ahead in this key PG metric.
Who had the better overall career, Brad Wanamaker or Kobe Bryant?
Based on career statistics, Kobe Bryant edges Brad Wanamaker 7-1 across key categories. Kobe Bryant's Points Per Game of 25.0 leads Brad Wanamaker's 5.5 by 354.5%, providing the clearest statistical evidence of the career advantage.