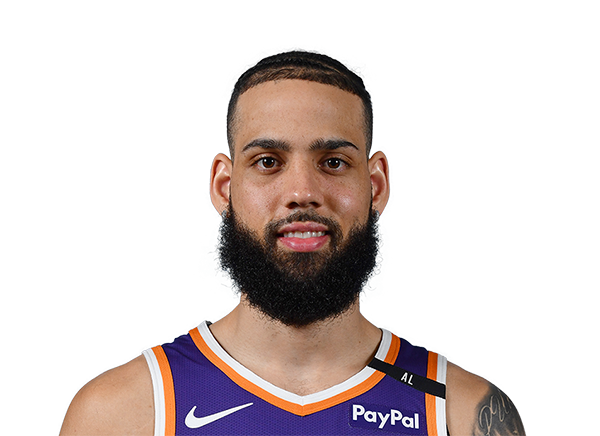
Chandler Parsons vs Andrei Kirilenko Career Stats Comparison


The career statistics tell a clear story in this SF comparison. Andrei Kirilenko holds the advantage in 5 of 7 key categories, with Blocks Per Game representing the most decisive gap — a 500% difference that separates these two NBA players. This is not a close debate on the numbers.
Andrei Kirilenko's Blocks Per Game of 1.8 compared to Chandler Parsons's 0.3 represents a 500% advantage — dramatically better than their counterpart in this critical category. It is the single most decisive number in this comparison and the clearest statistical argument for Andrei Kirilenko's edge.
The most competitive category in this matchup is Field Goal %, where Chandler Parsons posts 46.2% against Andrei Kirilenko's 47.4% — a gap of just 2.6%. Chandler Parsons can point to this as evidence that the overall comparison is closer than the final 5-2 tally suggests. In any debate, Field Goal % is the statistical ammunition for the Chandler Parsons side.
The forward position in professional basketball demands versatility — the ability to score, rebound and defend at an elite level. The most decorated forwards in NBA history have excelled across multiple statistical categories.
Andrei Kirilenko wins this head to head comparison decisively — 5 categories to 2. The 500% gap in Blocks Per Game alone makes a compelling case, but the consistency across multiple categories confirms Andrei Kirilenko's statistical superiority in this NBA career comparison.
Who is better, Chandler Parsons or Andrei Kirilenko?
Andrei Kirilenko holds the statistical edge, winning 5 of 7 categories in this career comparison. Andrei Kirilenko's Blocks Per Game of 1.8 versus Chandler Parsons's 0.3 is the most decisive factor — a 500% difference.
How do Chandler Parsons and Andrei Kirilenko compare in Blocks Per Game?
Chandler Parsons career Blocks Per Game: 0.3. Andrei Kirilenko career Blocks Per Game: 1.8. Andrei Kirilenko leads by 500% — dramatically ahead in this key SF metric.
Who had the better overall career, Chandler Parsons or Andrei Kirilenko?
Based on career statistics, Andrei Kirilenko edges Chandler Parsons 5-2 across key categories. Andrei Kirilenko's Blocks Per Game of 1.8 leads Chandler Parsons's 0.3 by 500%, providing the clearest statistical evidence of the career advantage.