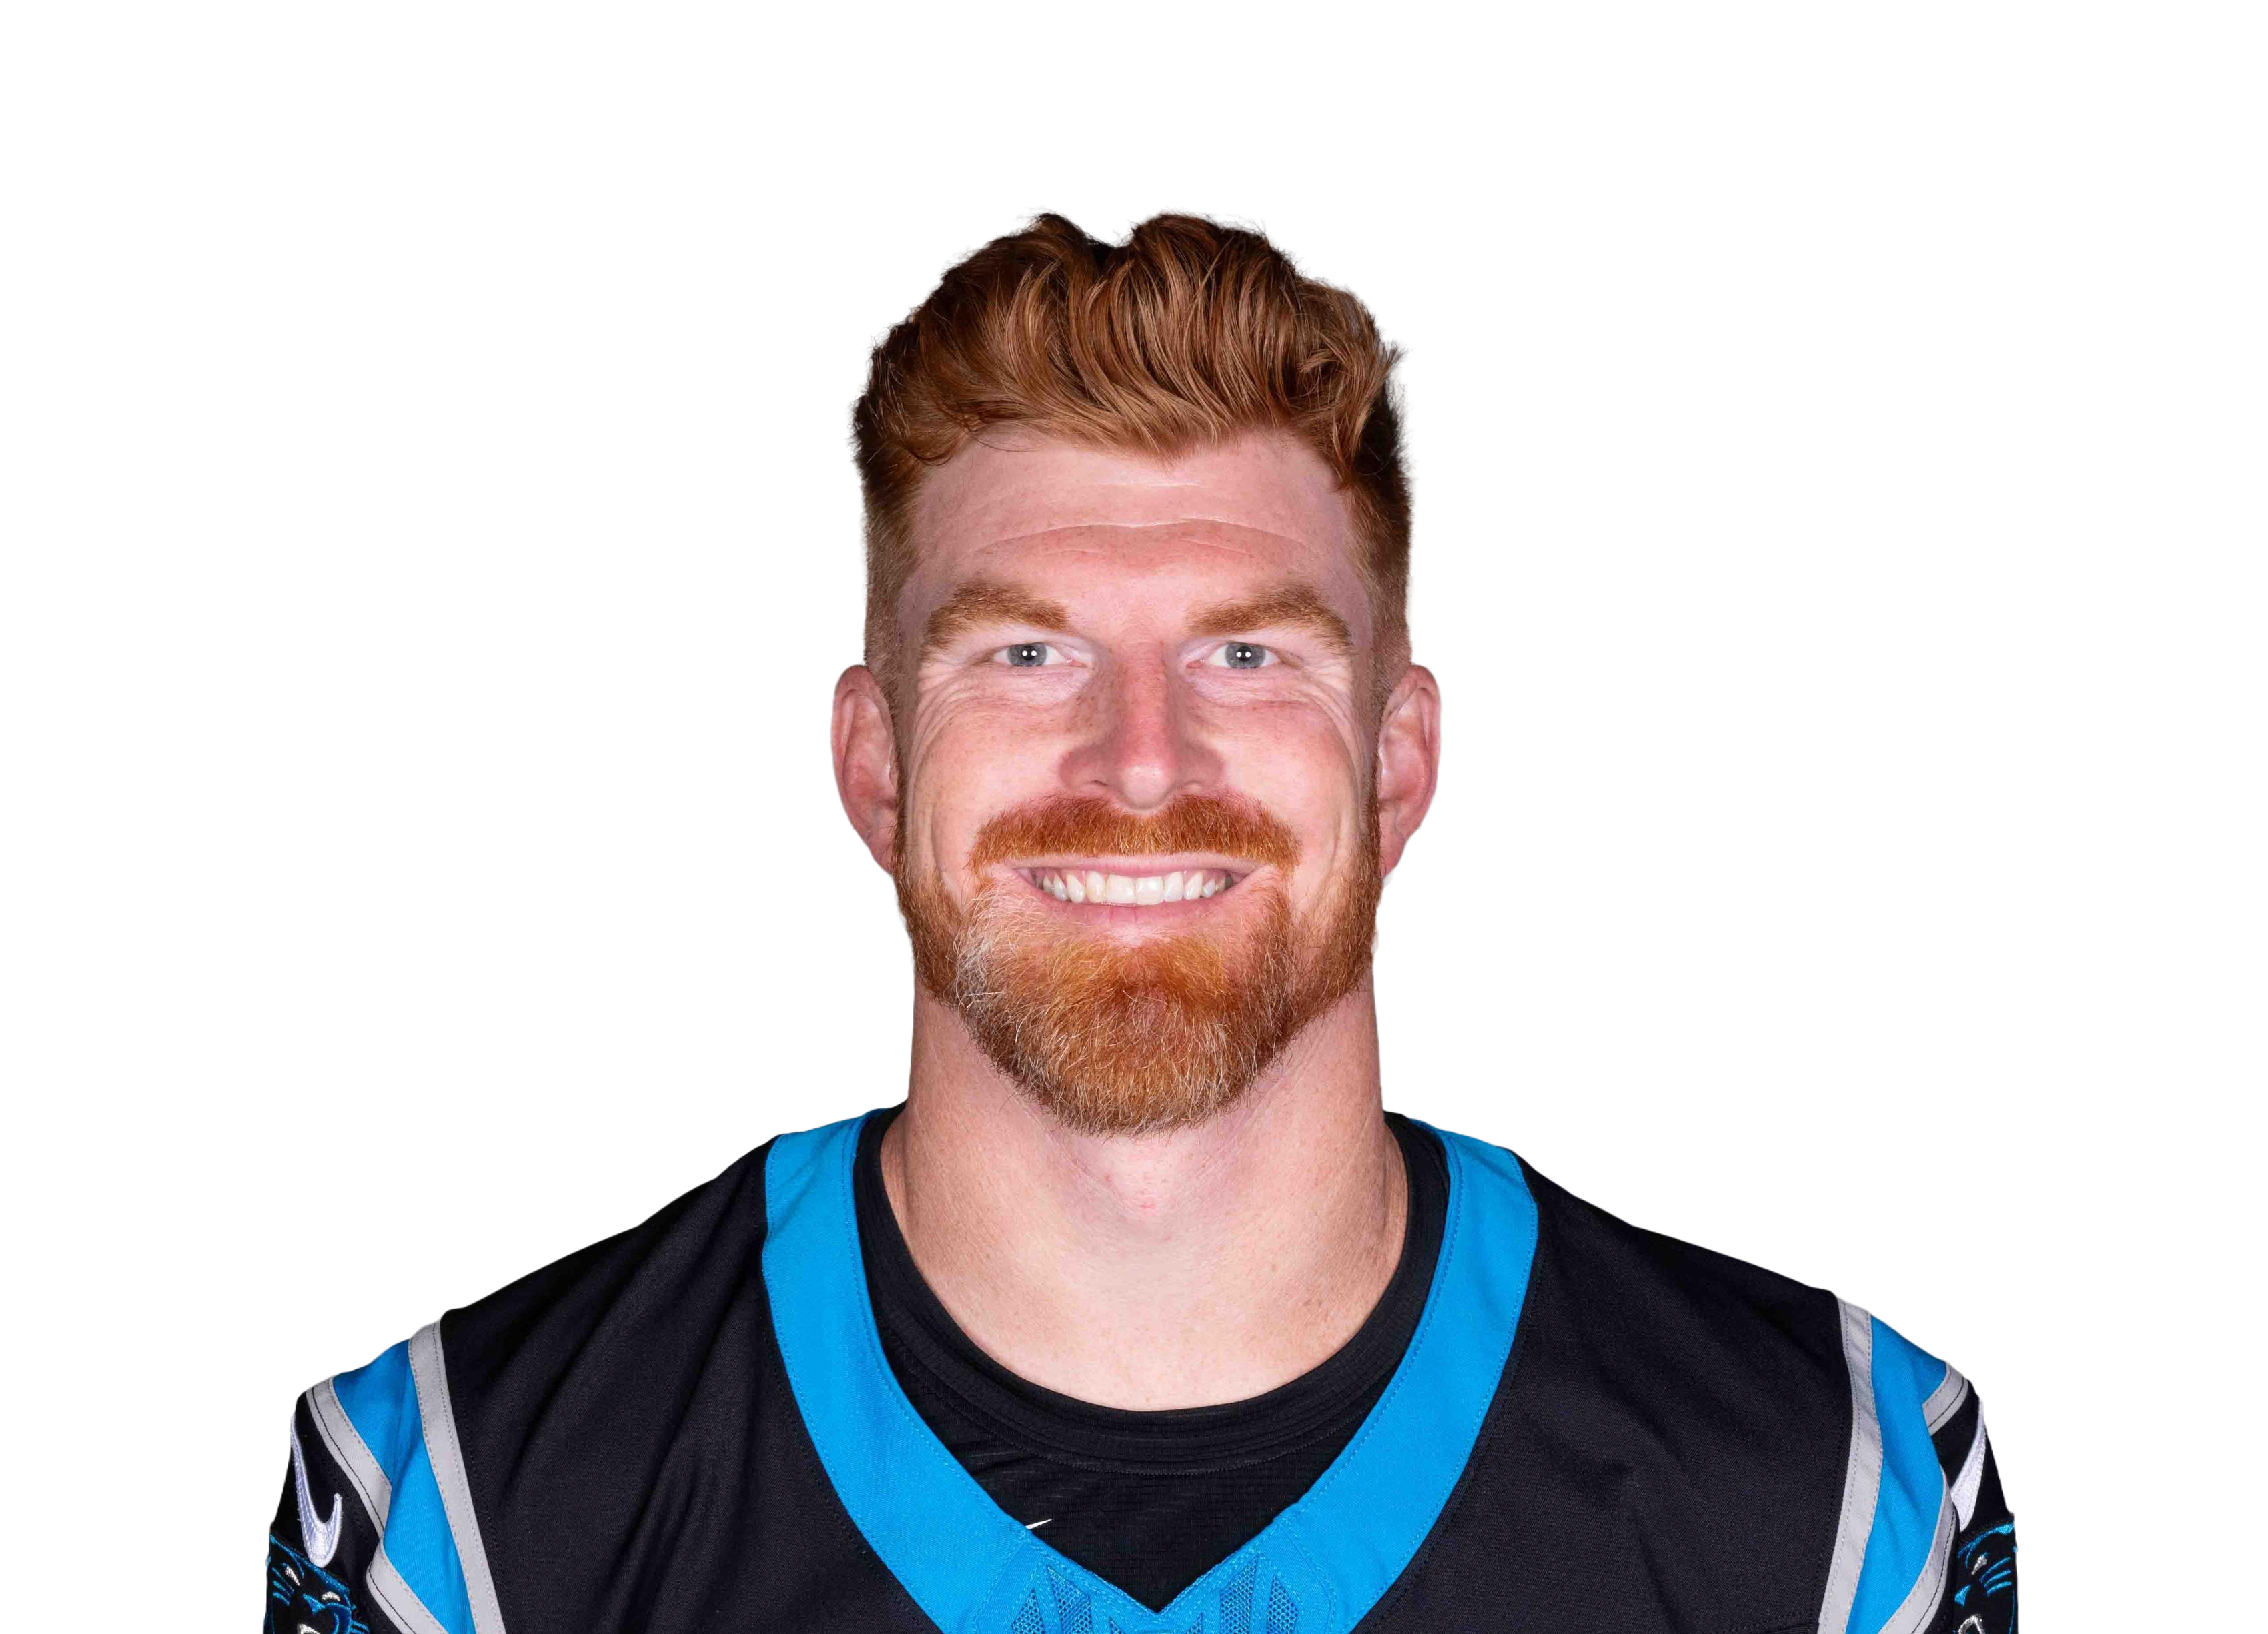
Andrew Luck vs Josh Allen: Who Wins on NFL Stats?


**Statistically, this isn't even close.** Josh Allen demolishes Andrew Luck in nearly every meaningful category, winning six of seven statistical comparisons. Allen's 94.4 passer rating trumps Luck's 89.5, while his superior completion percentage (64.0% vs 60.8%) and yards per attempt (7.4 vs 7.2) showcase better efficiency. The volume stats paint an even starker picture—Allen has thrown 49 more touchdowns despite playing just 42 more games, translating to significantly better per-game production.
**Luck's signature strength was his clutch gene and football IQ under pressure,** consistently engineering fourth-quarter comebacks with surgical precision. Allen's calling card is pure dynamism—he's a dual-threat monster who can torch defenses with his cannon arm or bulldoze linebackers with his 6'5" frame. Where Luck was cerebral, Allen is explosive.
**The numbers tell a story that context can't erase.** Yes, Luck played behind worse offensive lines and retired early due to injuries, but great quarterbacks overcome adversity. Allen has proven more durable, more productive, and more efficient while carrying Buffalo to sustained success that Luck never achieved in Indianapolis. **Josh Allen is the superior quarterback.**
Who is better, Andrew Luck or Josh Allen?
Josh Allen holds the statistical edge, winning 6 of 7 categories in this career comparison. Josh Allen's Games Played of 134 versus Andrew Luck's 86 is the most decisive factor — a 55.8% difference.
How do Andrew Luck and Josh Allen compare in Games Played?
Andrew Luck career Games Played: 86. Josh Allen career Games Played: 134. Josh Allen leads by 55.8% — dramatically ahead in this key QB metric.
Who had the better overall career, Andrew Luck or Josh Allen?
Based on career statistics, Josh Allen edges Andrew Luck 6-1 across key categories. Josh Allen's Games Played of 134 leads Andrew Luck's 86 by 55.8%, providing the clearest statistical evidence of the career advantage.