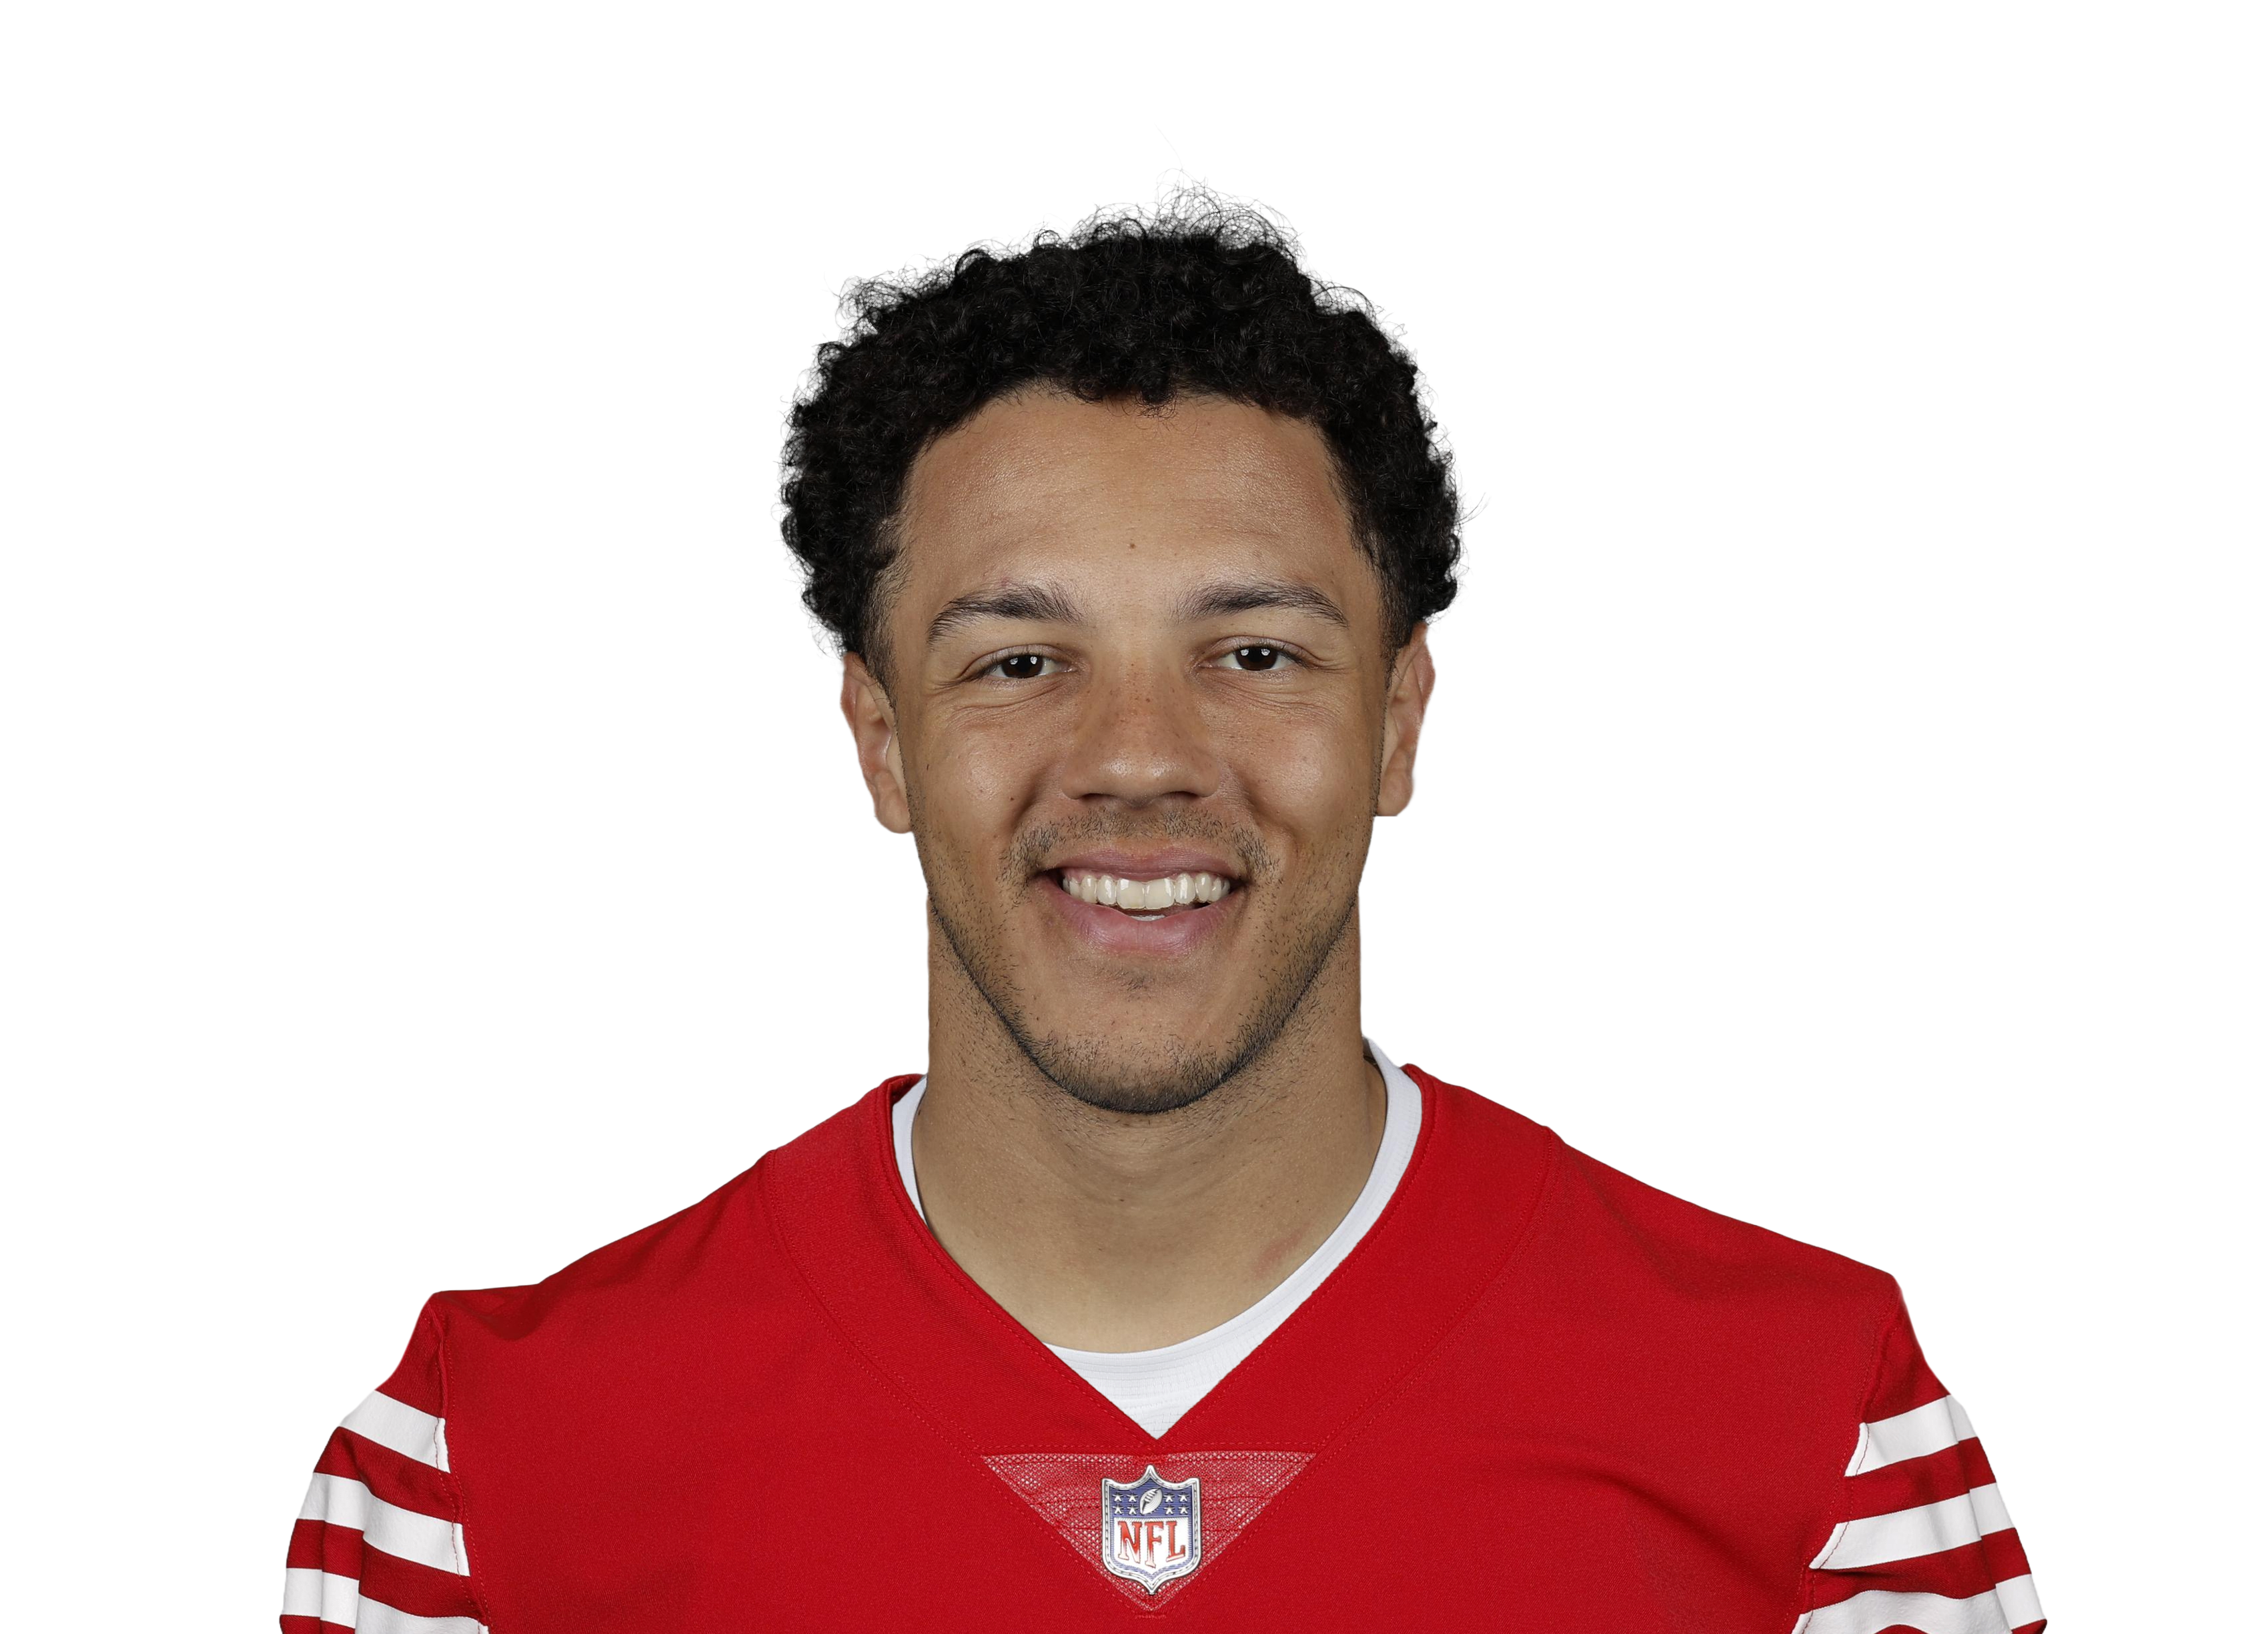
Andrew Luck or Tom Brady? The NFL Stat Breakdown
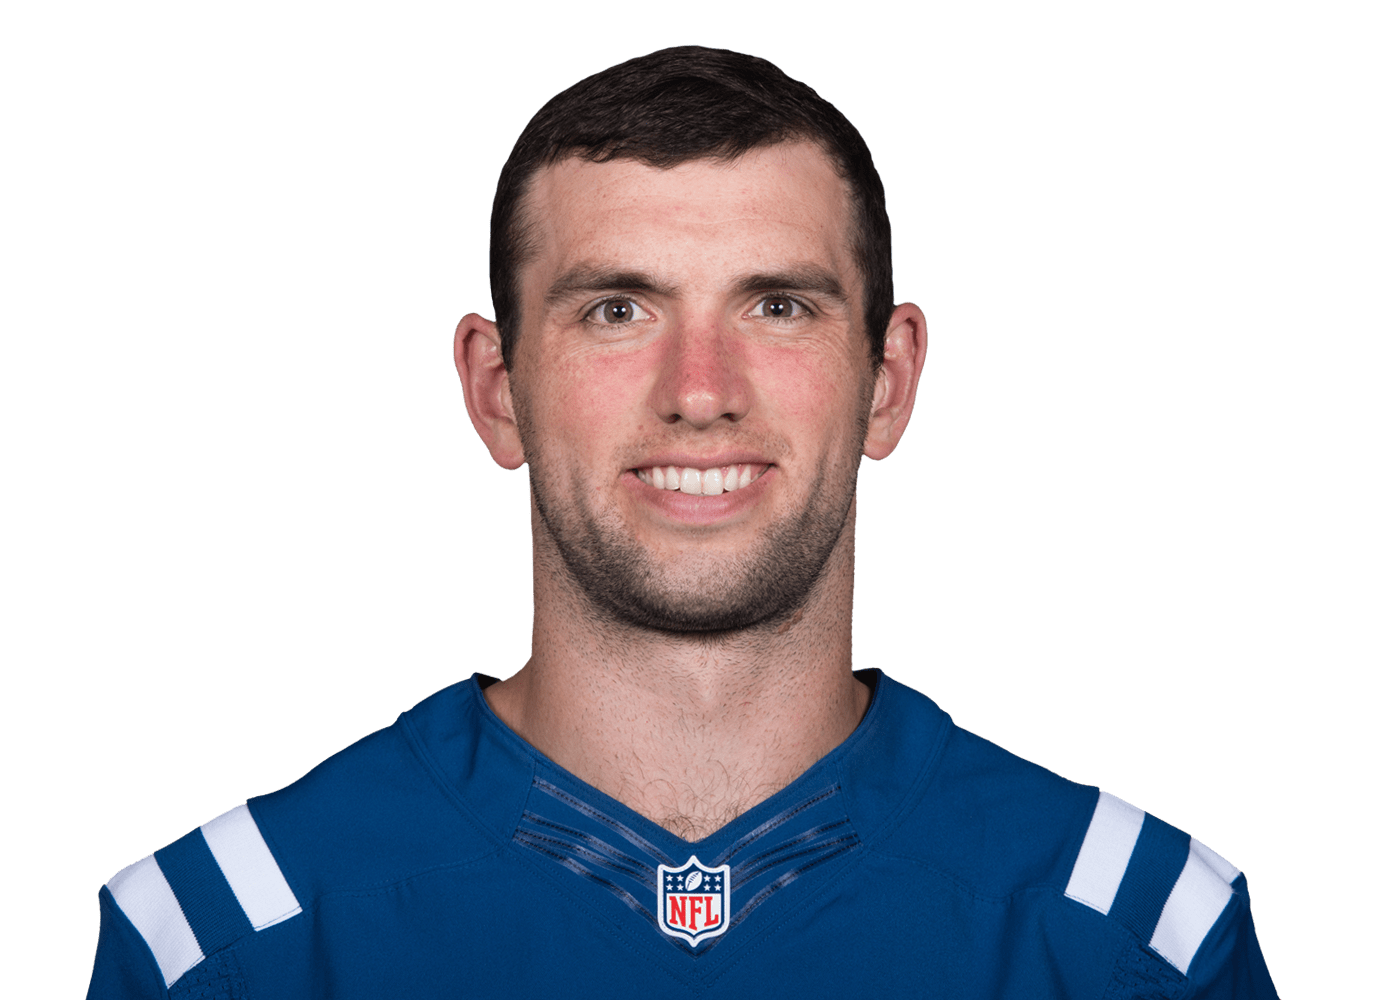
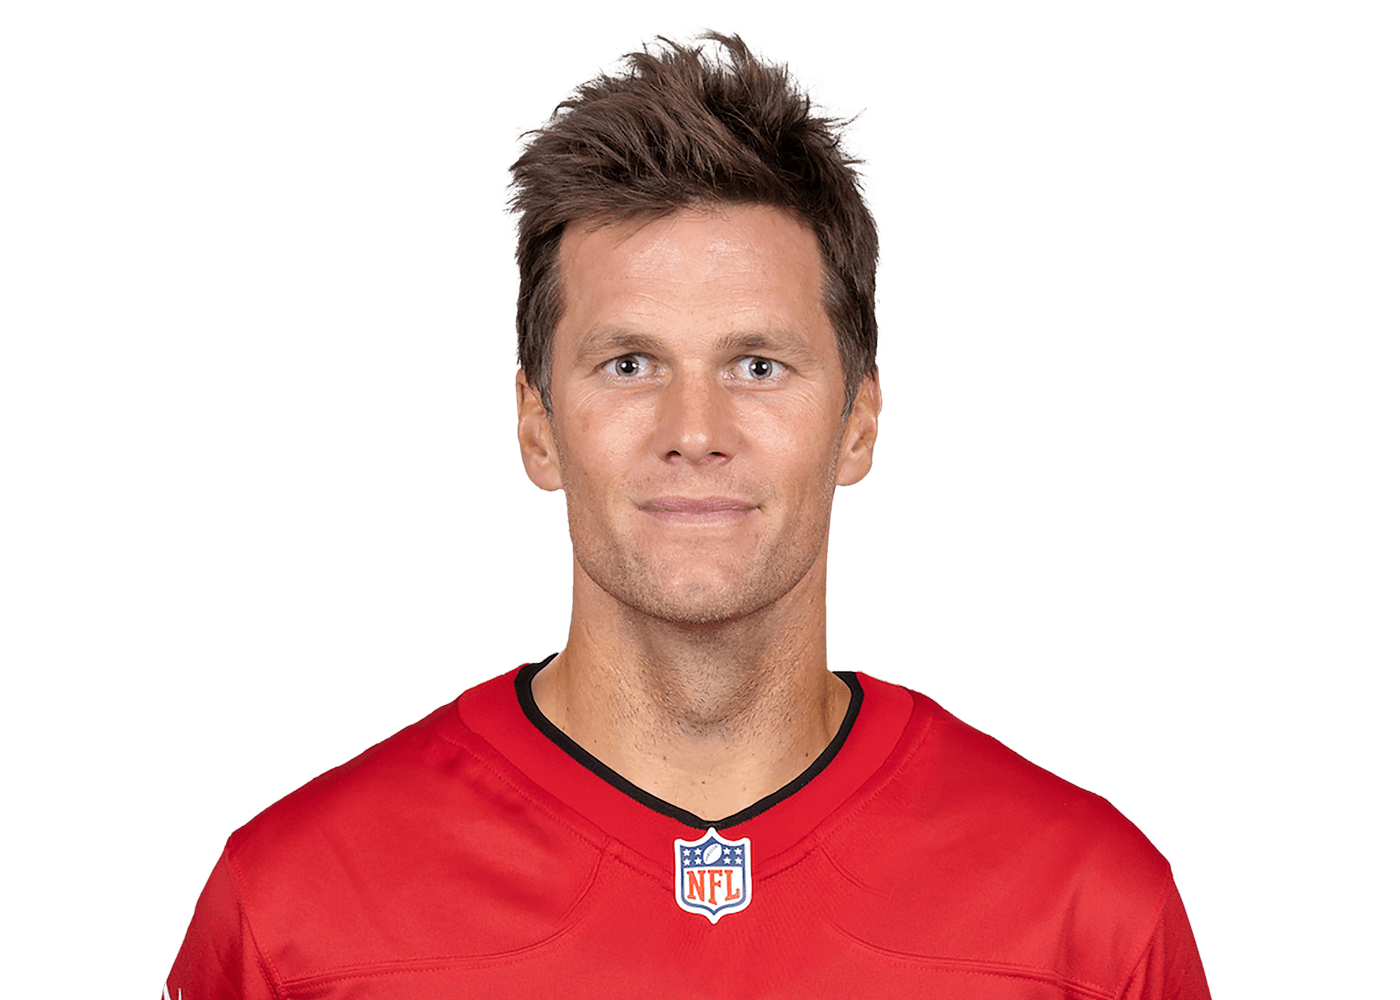
**Brady dominates this comparison statistically, and it's not even close.** He wins six of seven categories, posting a superior 97.7 passer rating to Luck's 89.5, throwing for nearly four times the yardage (89,214 vs 23,671), and maintaining better accuracy at 64.0% completion rate. Brady's 7.5 yards per attempt edge shows he was more efficient downfield, while his 649 touchdowns dwarf Luck's 171 despite throwing proportionally fewer picks per game.
**Luck's signature strength was his cannon arm and clutch gene** - he could thread impossible throws and engineer miraculous comebacks that left you speechless. The man was pure electricity in crunch time. **Brady's defining trait was surgical precision and championship mentality** - he methodically dissected defenses with laser accuracy and ice-cold composure when the lights burned brightest.
**This isn't about disrespecting Luck's immense talent or lamenting his injury-shortened career.** Raw numbers tell only part of the story, but Brady's sustained excellence over 335 games versus Luck's 86-game sample size makes this comparison almost unfair. One was a spectacular shooting star; the other was the North Star of NFL quarterbacking for two decades. **Tom Brady is unquestionably the better player.**
Who is better, Andrew Luck or Tom Brady?
Tom Brady holds the statistical edge, winning 6 of 7 categories in this career comparison. Tom Brady's Games Played of 335 versus Andrew Luck's 86 is the most decisive factor — a 289.5% difference.
How do Andrew Luck and Tom Brady compare in Games Played?
Andrew Luck career Games Played: 86. Tom Brady career Games Played: 335. Tom Brady leads by 289.5% — dramatically ahead in this key QB metric.
Who had the better overall career, Andrew Luck or Tom Brady?
Based on career statistics, Tom Brady edges Andrew Luck 6-1 across key categories. Tom Brady's Games Played of 335 leads Andrew Luck's 86 by 289.5%, providing the clearest statistical evidence of the career advantage.