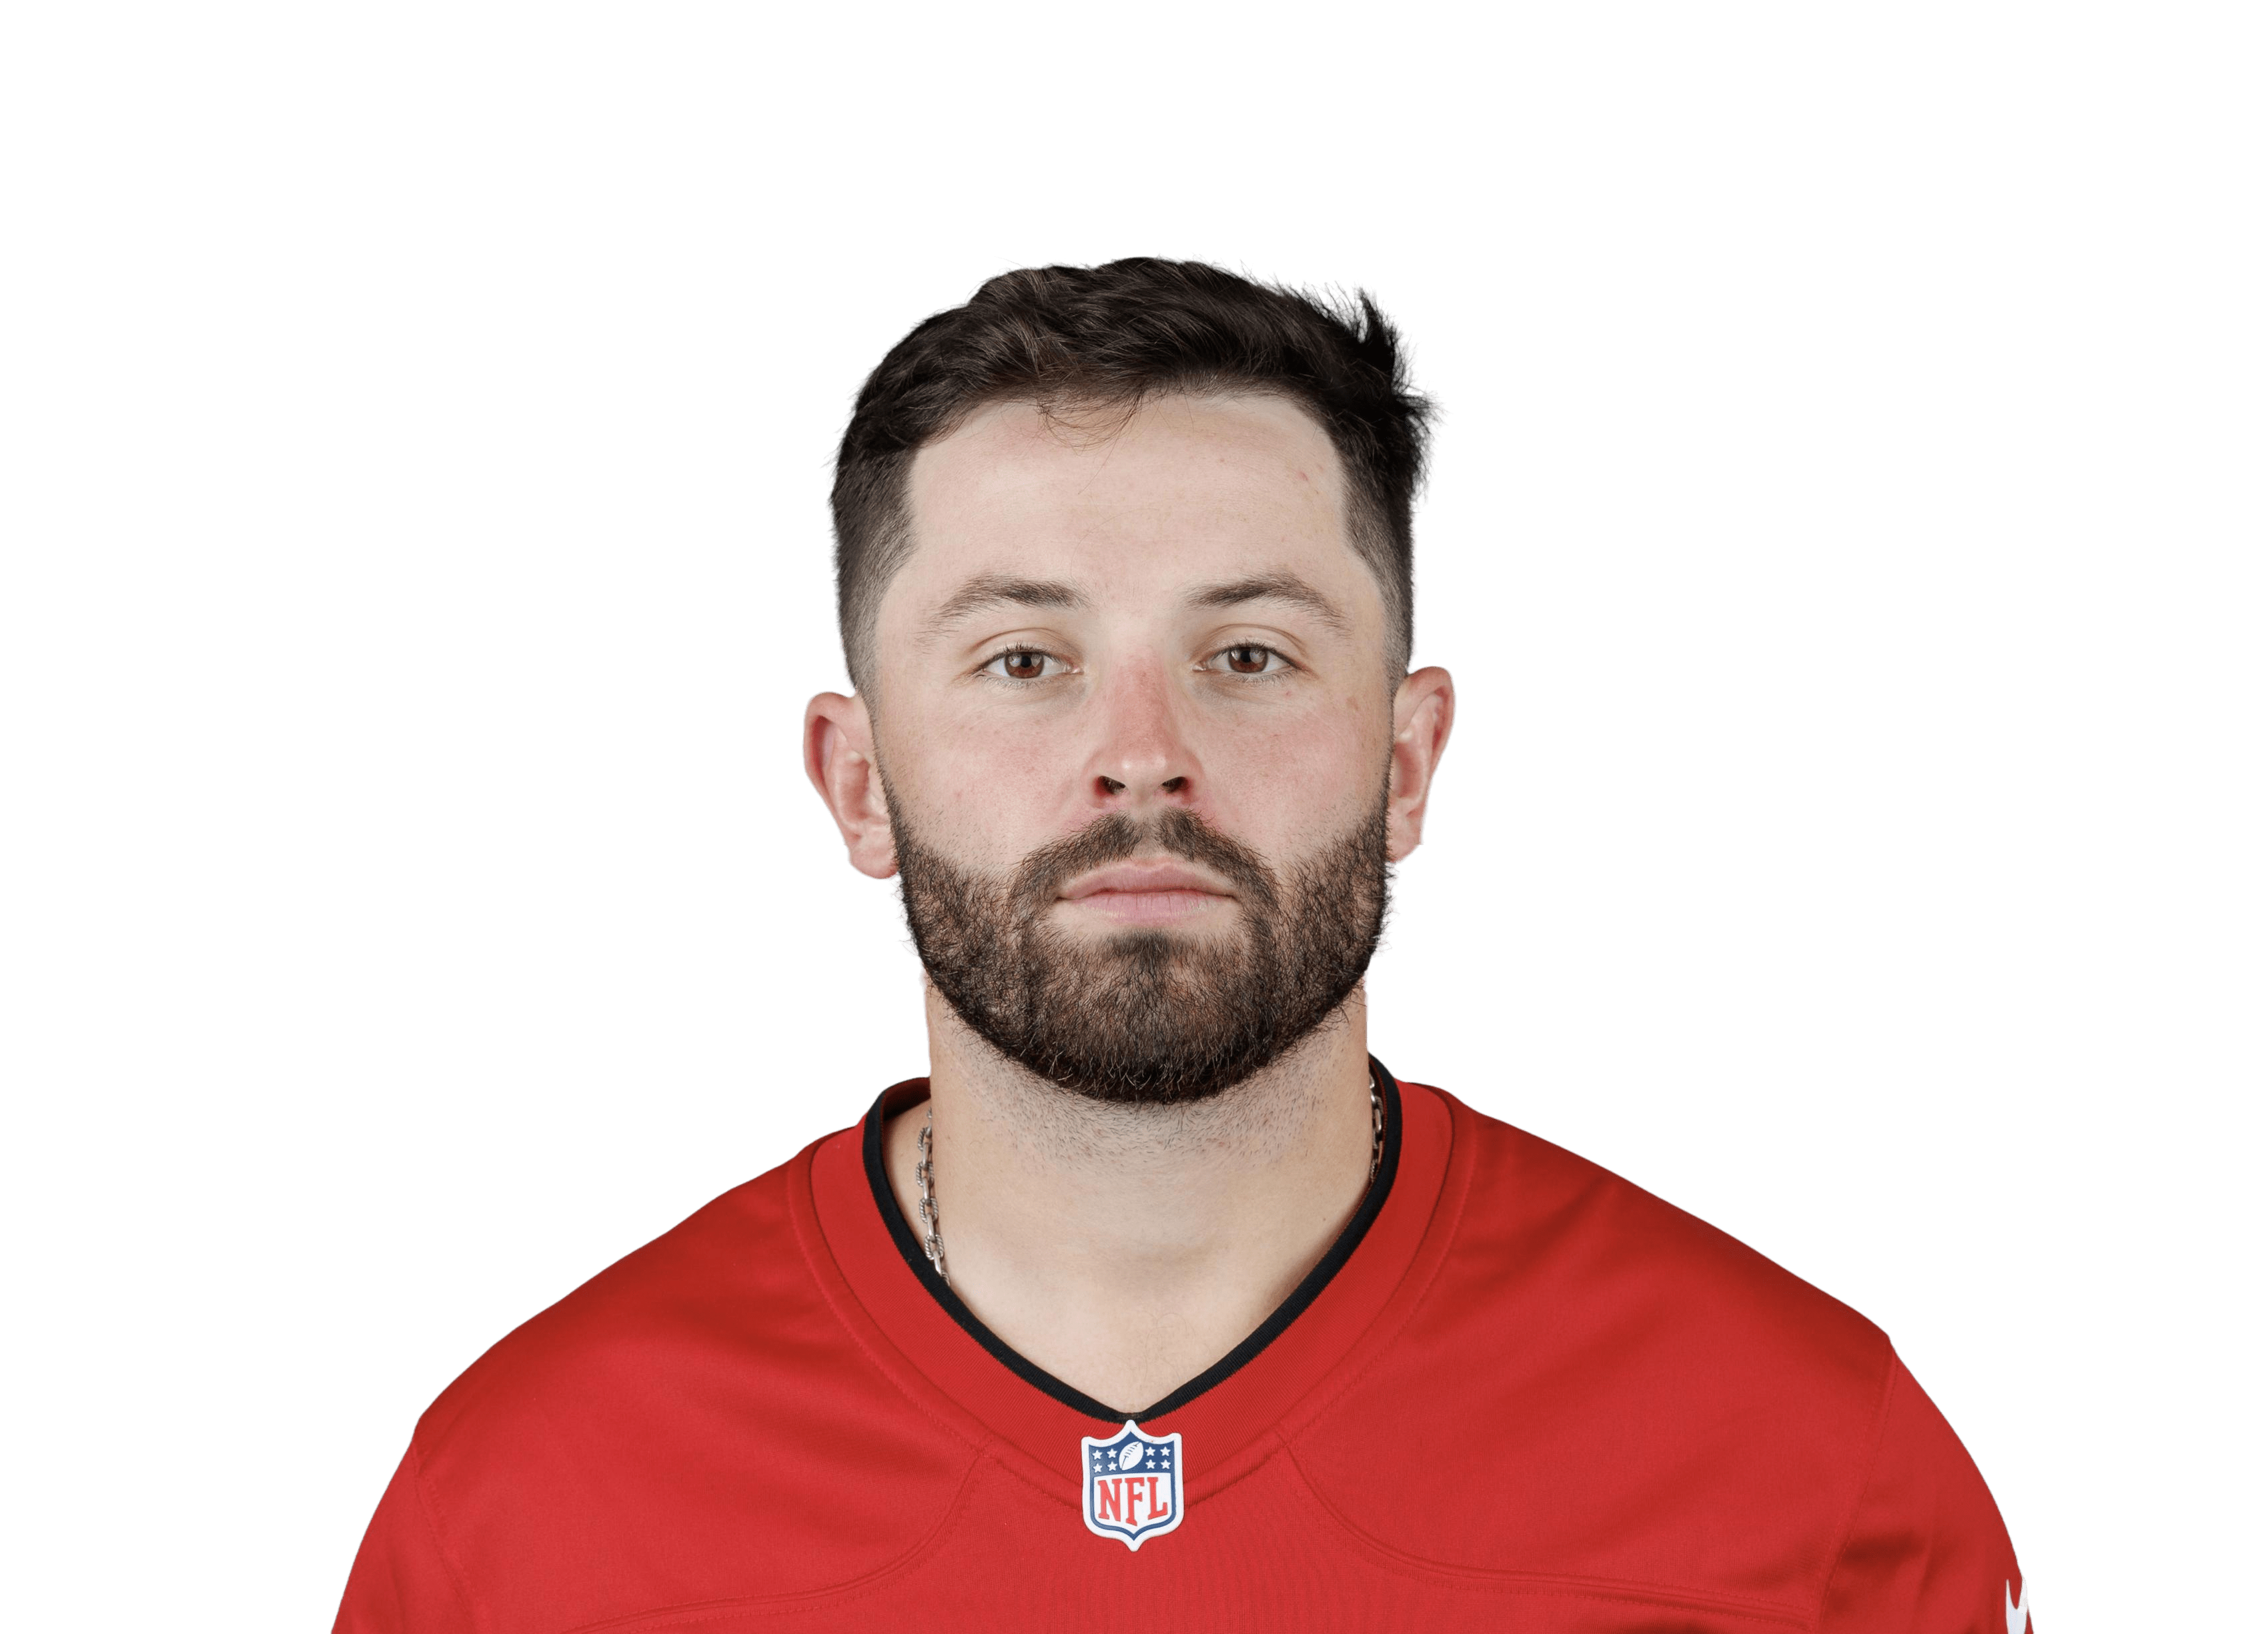
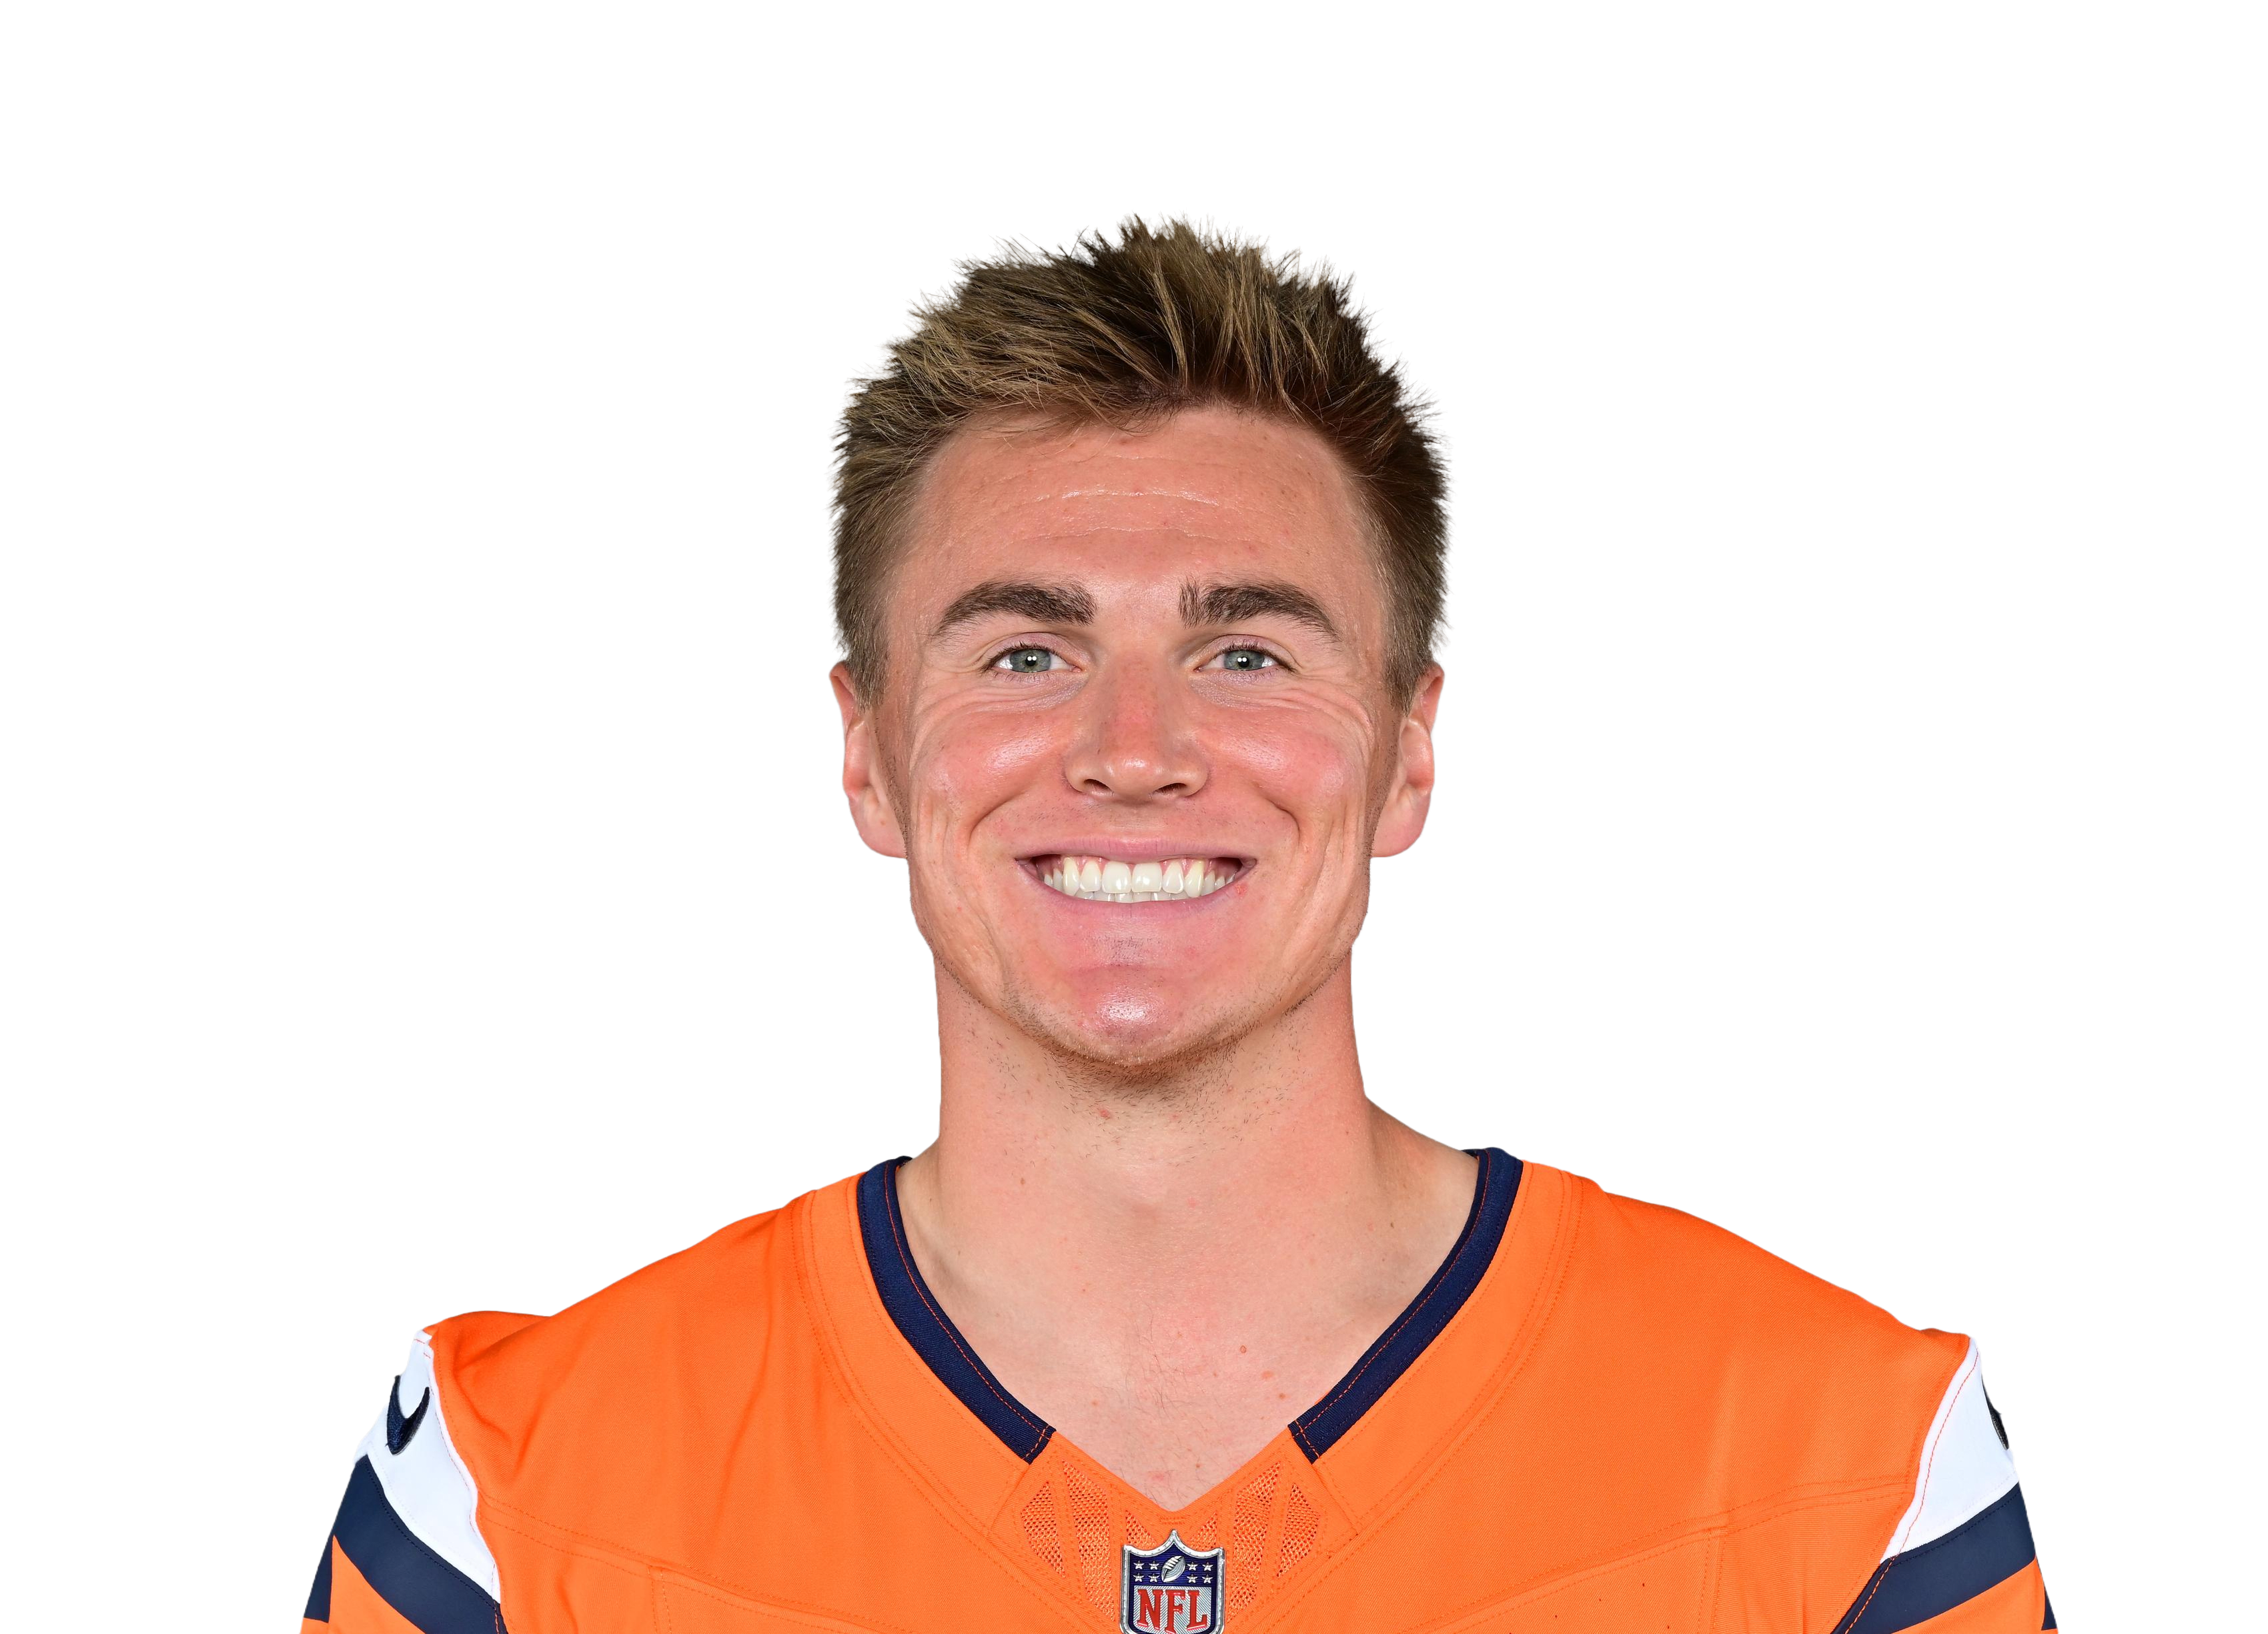
Bo Nix or Brock Purdy? The NFL Stat Breakdown

**Statistically, this isn't even close.** Purdy demolishes Nix in virtually every meaningful metric, winning six of seven categories. His 104.0 passer rating towers over Nix's 90.5, while his 8.6 yards per attempt absolutely embarrasses Nix's pedestrian 6.5. Purdy's 67.9% completion percentage and superior touchdown-to-interception efficiency (84 TDs, 37 INTs vs. 54 TDs, 23 INTs) showcase a quarterback who simply operates on a different level of precision and productivity.
**Nix's lone statistical victory comes in interception avoidance,** but that's largely because he plays it safe with shorter, less challenging throws. His signature strength is game management and limiting turnovers, making him a steady but unspectacular presence. Purdy's calling card, meanwhile, is explosive downfield accuracy and red zone excellence—his 2.4 yards per attempt advantage screams elite arm talent and decision-making that consistently creates big plays.
**The numbers paint a clear picture of hierarchy.** Purdy isn't just better; he's operating in a completely different stratosphere of quarterback play, combining efficiency with explosive playmaking ability that Nix simply cannot match. Brock Purdy is the superior quarterback by every measure that matters.
Who is better, Bo Nix or Brock Purdy?
Brock Purdy holds the statistical edge, winning 6 of 7 categories in this career comparison. Brock Purdy's Pass Touchdowns of 95 versus Bo Nix's 59 is the most decisive factor — a 61% difference.
How do Bo Nix and Brock Purdy compare in Pass Touchdowns?
Bo Nix career Pass Touchdowns: 59. Brock Purdy career Pass Touchdowns: 95. Brock Purdy leads by 61% — dramatically ahead in this key QB metric.
Who had the better overall career, Bo Nix or Brock Purdy?
Based on career statistics, Brock Purdy edges Bo Nix 6-1 across key categories. Brock Purdy's Pass Touchdowns of 95 leads Bo Nix's 59 by 61%, providing the clearest statistical evidence of the career advantage.